NASA Goddard Space Flight CenterAnna Trindade FalcãoMultiwavelength astrophysicist · Black-hole winds · AGN feedback
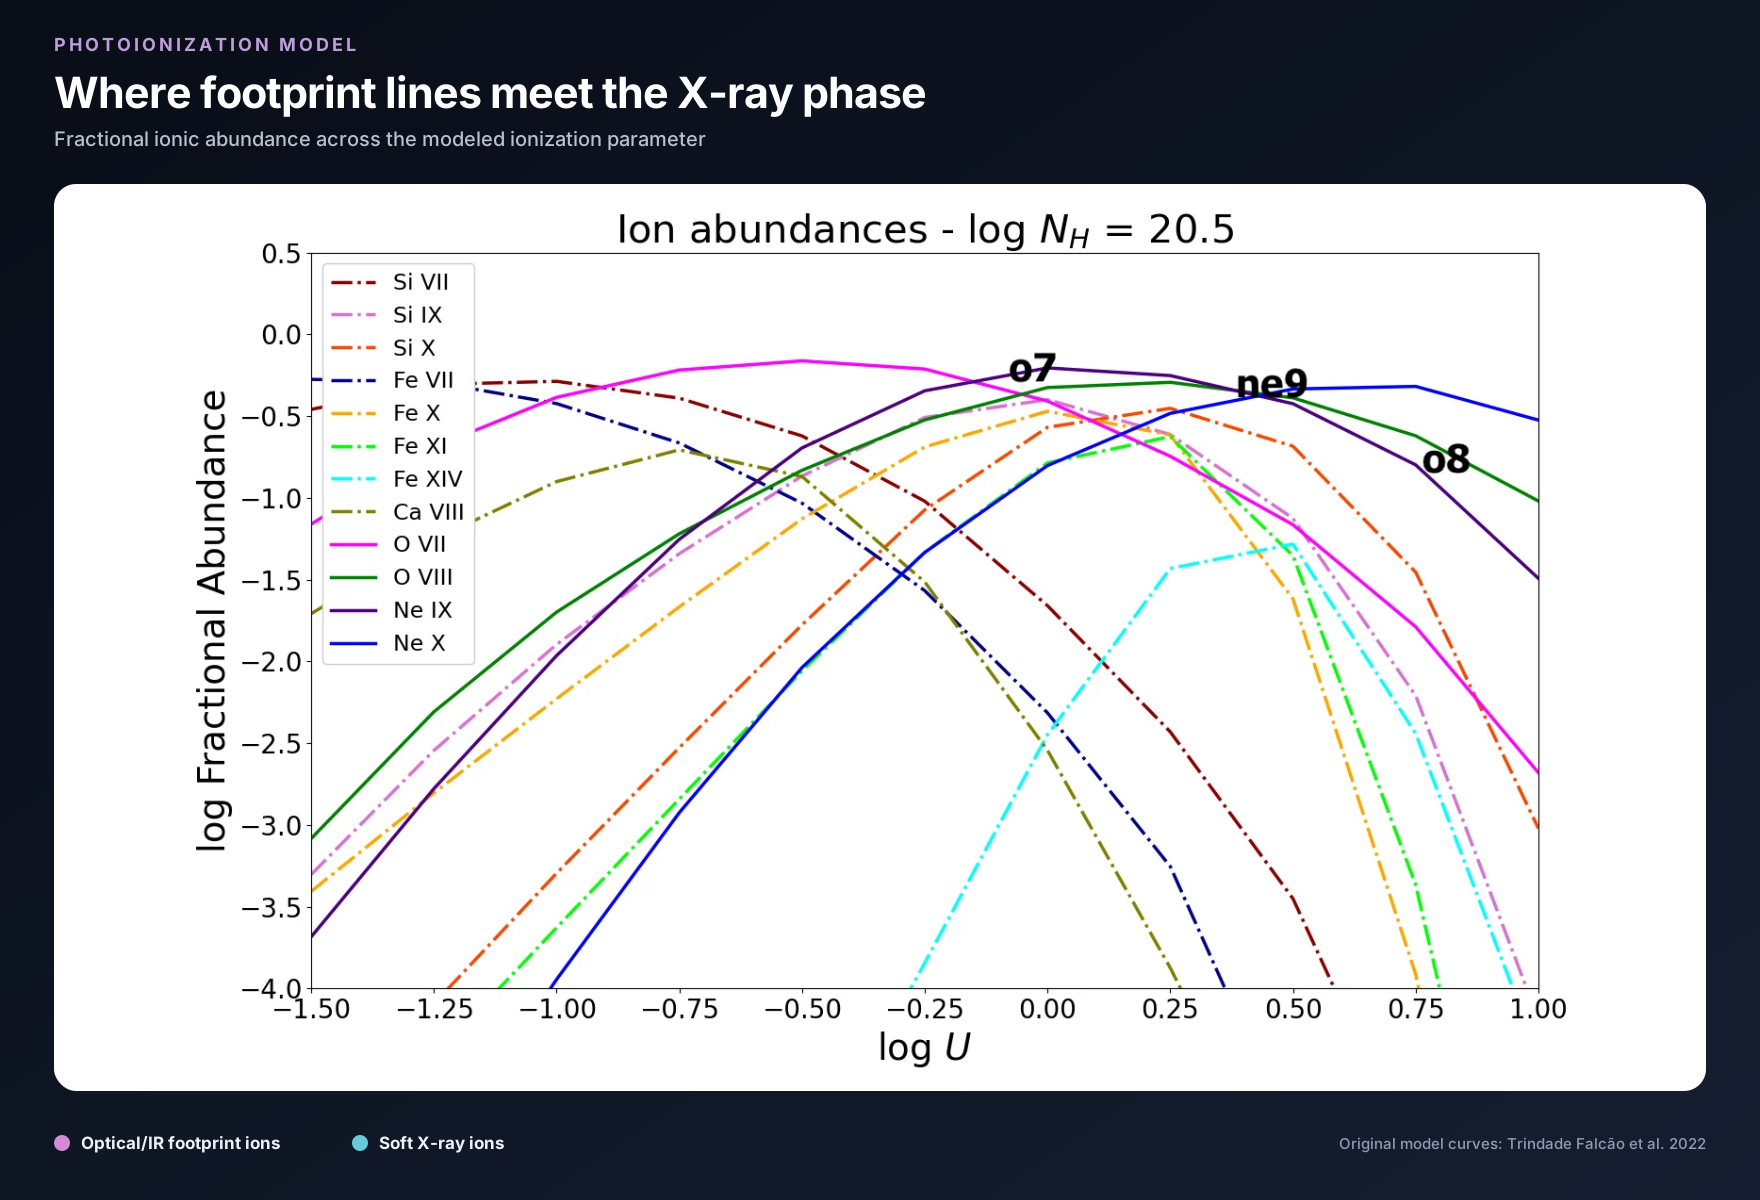
Cloudy model plot for the log NH = 20.5 top-left panel of published Figure 1. Curves show modeled fractional ionic abundances versus log U for Si, Fe, Ca, O, and Ne ions; bold labels mark the modeled O VII, Ne IX, and O VIII X-ray-line peak-flux positions. This is a photoionization-model result, not a direct observation, measured spatial correspondence, kinematic measurement, outflow-rate measurement, or feedback result.
← All publications

Research article · 2022

Tracking X-ray outflows with optical/infrared footprint lines

MNRAS 511(1), 1420–1430 (2022)

Paper-derived Cloudy model plot · Published Figure 1 top-left panel

Published Figure 1, top-left panel. Cloudy-predicted fractional ionic abundances versus ionization parameter log U for NH = 10^20.5 cm−2. Curves trace Si VII, Si IX, Si X, Fe VII, Fe X, Fe XI, Fe XIV, Ca VIII, O VII, O VIII, Ne IX, and Ne X; bold O VII, Ne IX, and O VIII labels mark the modeled ionization parameters of their X-ray-line peak fluxes. The plotted overlap is a photoionization-model result, not a direct observation, measured spatial correspondence, kinematic measurement, outflow-rate measurement, or feedback result.

Figure 1, top-left panel, from Trindade Falcão et al. 2022, “Tracking X-ray outflows with optical/infrared footprint lines,” MNRAS 511, issue 1, 1420–1430, DOI: 10.1093/mnras/stac173. © 2022 The Author(s), published by Oxford University Press on behalf of the Royal Astronomical Society. Converted from PNG to WebP for non-commercial research presentation under the RAS figure-reuse policy.

Research summary

Establishing the X-ray footprint method

This model-defined tracer-method study tests a single target, NGC 4151. “Footprint lines” are a model-selected subset of coronal lines from ions with ionization potentials of at least 138 eV whose modeled ionization ranges overlap those of H- and He-like oxygen and neon. Cloudy 17.00 predictions based on earlier Chandra/HETG photoionization parameters and emitting areas are compared with archival HST/STIS G750L [Fe X] and [O III] profiles, archival HST/WFPC2 [O III] imaging, and published ground-based near-infrared line fluxes. The model-derived spatially integrated X-ray-emitting gas mass, 7.8 ± 2.1 × 10^5 M☉, agrees with the earlier Chandra-derived 5.4 ± 1.1 × 10^5 M☉. The available STIS spectrum does not provide accurate [Fe X] kinematics, so this paper does not measure an X-ray velocity field or derive an NGC 4151 mass-outflow rate, kinetic power, feedback efficiency, or causal feedback. The earlier approximately 1.8 M☉ yr−1 value belongs to Kraemer et al. 2020 and assumes that the X-ray gas follows the [O III] kinematics. Tracer selection is not universal and depends on ionization state, spectral energy distribution, column density, dust depletion, atomic data, and photoionization structure; more highly ionized active galaxies may require other tracers.